FXParabol EA Review & Live Statistics 2024

Live Statistics of FXParabol with the Real Money Results

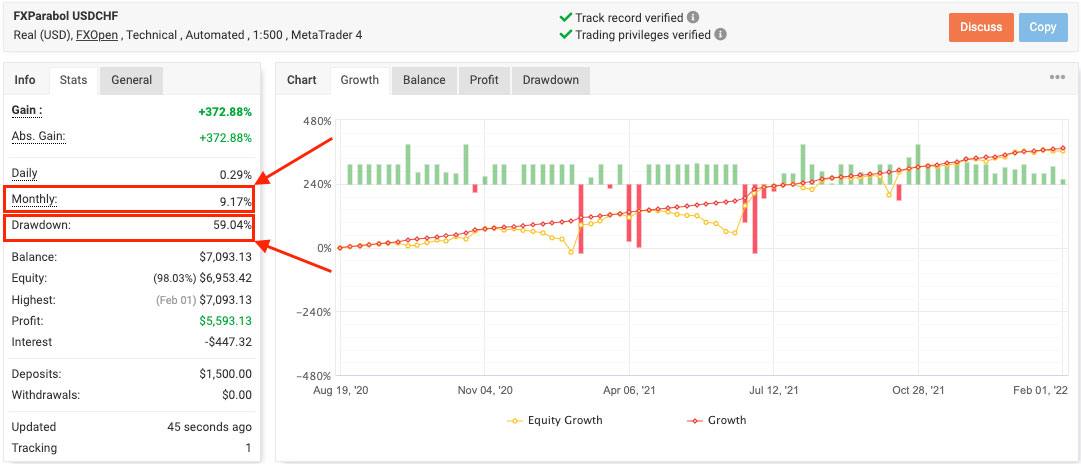
The FXParabol EA has got two real live trading accounts on Myfxbook service where it trades on different currency pairs – EURUSD, USDJPY and USDCHF. Both accounts have been trading live since August 19, 2020, which allows us to analyze approximately 1.5 years of live trading. Starting with the initial deposit of $1000 and $1500 the FXParabol EA has reached profits of 427% and 372% respectively. Looking at the smoothness of the graphs, we have to admit that this Forex robot has been able to keep its trading graphs clean from deep fixed drawdowns and significant losses. Graphs look strongly moving up and show no signs of sharp-edged movement.

FXParabol EURUSD, USDJPY, USDCHF Real

FX Parabol EA Backtest

FXParabol USDJPY Aggressive

FXParabol USDJPY Aggresive

FXParabol USDJPY Normal

FXParabol USDJPY Normal

FXParabol USDCHF Aggressive

FXParabol USDCHF Aggresive

FXParabol USDCHF Normal

FXParabol USDCHF Normal
The FXParabol EA developer made sure that the system is properly backtested on both currency pairs with different settings so that traders see the potential of the system. There are 4 backtests available for FXParabol EA – 2 backtests per currency pair that the system can trade on. Each of backtests shows solid profitability and strong durability of the system on the historic quotes testing.
The system has been tested in two different modes per currency pair – Aggressive and Normal. The Aggressive mode required a 100% risk and shows the maximum profitability of the system. The Normal mode shows the profitability of the system with recommended 35% risk setting. As we can see, both modes were successful and showed spectacular results.

All the backtests are made on a 1H timeframe using every tick testing model, which is the most precise method of backtesting based on all available least timeframes. The backtests’ modeling quality is 90%, which is okay for this EA because it does not use a scalping strategy. The system was tested on the historical quotes from 2015 and 2016 respectively for USDJPY and USDCHF currency pairs, which gives us results of 6 and 5 years of backtesting.

Profitability & Drawdown
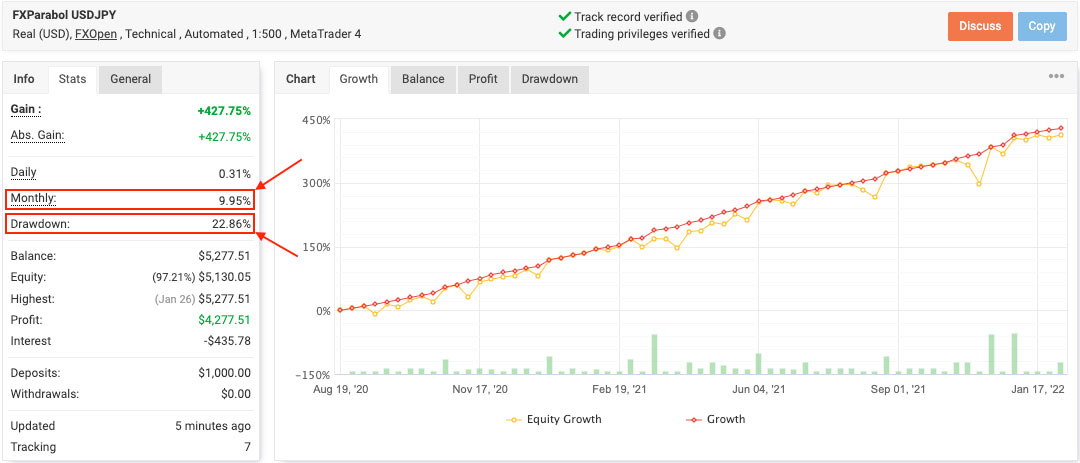
The live trading of the FXParabol EA has started on August 19, 2020, on both available live trading accounts of the robot with initial deposits of $1000 for the “FXParabol USDJPY” account and $1500 for the “FXParabol USDCHF” account. The FXParabol robot is designed to trade on two currency pairs and the developer made sure to represent live trading results on both of them, which is good for the full understanding of the real possibilities of this trading system.
The FXParabol EA has managed to grow the USDJPY account’s profit by 427% since the beginning of live trading. It is a pretty high result if considering that the maximum floating drawdown level the system has ever reached was only 22.8% and the average monthly compound rate of return is almost 10%.
FXParabol EA Review Profitability
The live trading numbers of the FXParabol robot that were previously described show us possible future outcomes of using this EA. Having 428% of cumulative gain reached in 18 months with the maximum fixed drawdown of 23%, the average profit to drawdown ratio is 0.43:1. These numbers might not be looking pretty impressive but still, it is good results to get profits with not that high risks.
The other trading account of FXParabol EA shows a bit different trading results. On the USDCHF account, the system uses an initial deposit of $1500 and has been able to reach 373% of gain during the 18 month live trading period. The monthly compound rate of return for this robot is quite close to the other accounts’ – 9.1%, but the floating drawdown level is much higher. The maximum floating drawdown level for the USDCHF account is 59%, which is a pretty high number.
FXParabol EA Review Drawdown
Considering the described numbers of this FXParabol account, we can calculate the approximate profitability to drawdown ratio. With 372% of cumulative gain that the system collected through the 18 months live trading period, and with a maximum fixed drawdown level of 59%, the average ratio should be around 0.15:1. This result is quite low for the Forex robot that wants to be called highly profitable.

Type of Trading

The main idea of the FXParabol EA is explained by the developer pretty clearly. The robot is designed as a fully automated system that bases its work exclusively on mathematical calculations and indicators analysis. The main instruments that are used by FXParabol EA are two trend indicators that work in pairs – the Parabolic SAR indicator and the Bollinger Bands indicator.
  1. The Parabolic SAR is the trend indicator that creates rows of dots under or above the price graph and shows the direction of the trend. Sometimes the line formed by the Parabolic SAR markers is considered as a dynamic support or resistance level. However, Parabolic is not just a trend-following indicator. It is also designed to determine trend reversal points (SAR stands for “Stop and Reverse”). A candle, on which the Parabolic marker moves from top to bottom or vice versa, is considered a reversal one.
  2. The Bollinger Bands is another indicator used by FXParabol EA, which is also the trend indicator. The indicator consists of 3 lines, the task of which is to measure the current market volatility. The middle line is the usual Moving Average. The distance of deviation of the upper and lower lines from the middle line proportionally depends on the price action. The higher the volatility, the stronger the deviation and the wider the corridor. The lower the volatility, the smaller the deviation, and the narrower the corridor.
  3. Well, not only, the combination of these two indicators is used in FXParabol EA to detect a trend and pick the perfect timing for the trade execution. The robot also uses a specific math algorithm that allows the system to compensate for losing trades.
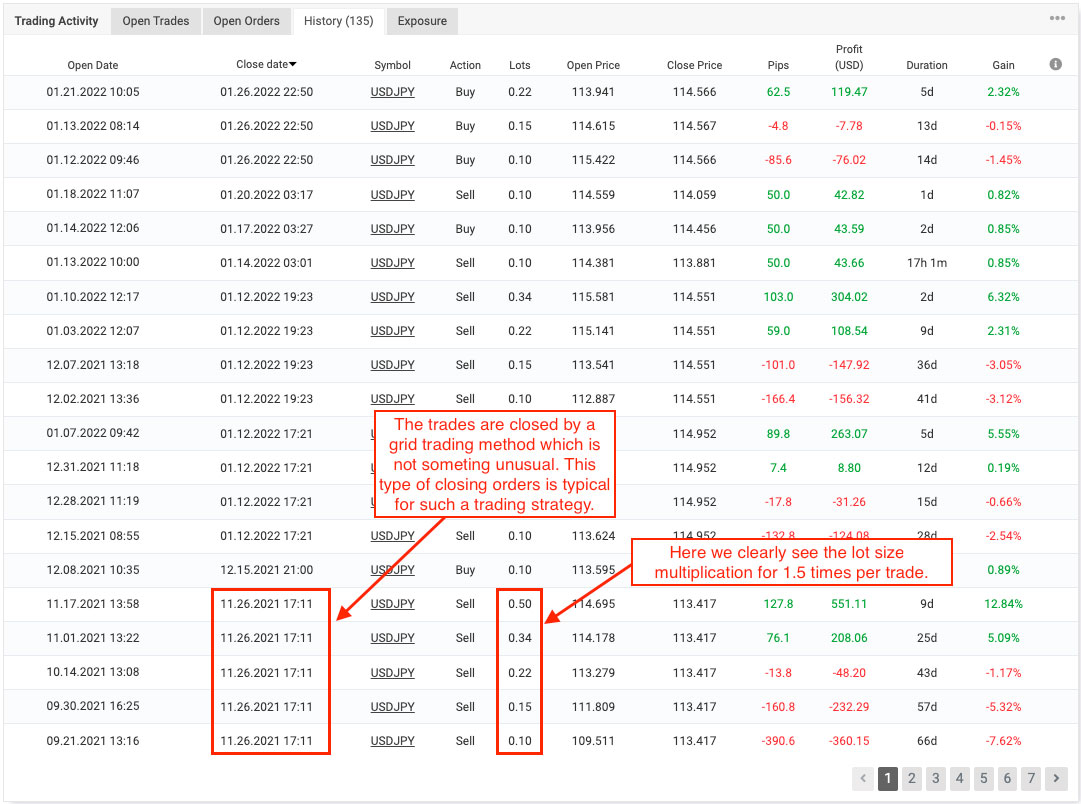
Moving to analyze the live performance of the FXParabol EA, we will concentrate on one live account to properly discover and understand the trading system that lies behind the name of the robot. I chose to analyze the “FXParabol USDJPY” account that operates starting from the initial deposit of $1000 and gained 427% of the profit.
We can clearly see from the graph that the system uses some kind of lot size growth due to the previous losing trades. But it must also be emphasized that the growth of lot size is pretty conservative. The system has this lot-size multiplication pattern: starting generally with the lot size of 0.10 the system grows next trades to 0.15, 0.22, 0.34, 0.50 of the lot. This means every lot size multiplication step is approximately multiplied by 1.5 times. You can see it from the graph below.
FXParabol EA Review Trading
It is also clear that the system uses a grid-looking way of placing and closing trades (we can see it from the screenshot above). This is not something extraordinary, as it is quite a typical approach to trading when using the lot multiplication method of recovery from losses. However, the system manages to be productive and stable in profit and reliability using such a strategy. This means that the calculations and work of the indicators complement each other and bring good results.

Another thing that we can obviously admit about the robot is that the FXParabol EA uses a preset level of lot size and pips taken per every first winning trade. This is clearly seen from the following screenshot. The lot size for every first winning trade is usually 0.10 and the amount of taken pips is 50.0 pips.

FXParabol EA Review Type of Trading
Moving ahead, it is important to see the density of trades during the trading period of the robot. The FXParabol EA has made 134 trades during the 18 months trading history on the real account. This makes it doing approximately 7.3 trades per month which is not too many. But this is fine due to the chosen trading strategy that includes gridding and lot multiplication, which also requires waiting and analyzing the market movement.

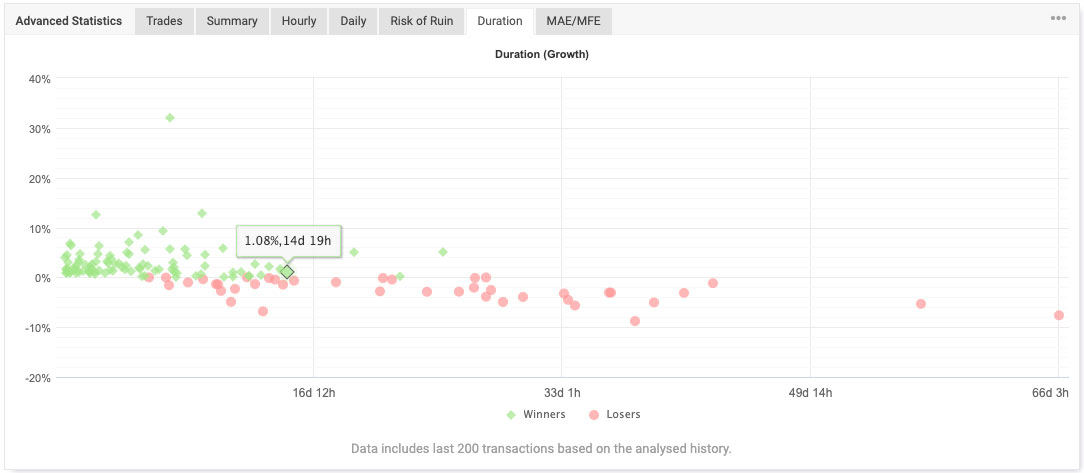
The duration of trades being opened for FXParabol EA is in the range of 1 hour to 15 days. This means that the system can and would be keeping trades open to reach the desired gain level. FXParabol EA is not the system that would be closing deals a few times every day. Also, it is seen from the screenshot below that usually the trades that are kept open by this Forex robot longer than 15 days become losing once. The most profitable trading periods range for FXParabol is from 1 hour to 5 days. There are no losing trades closed in this period during the trading history of the system.
FXParabol EA Review Duration of Trades

Conclusion

The FXParabol EA, as we saw in the review, is a pretty solid robot that can bring profits due to the great combination of technical indicators that work for it and the mathematical calculations performed by the system. The robot can be profitable and reliable at the same time, which is key to success in the modern Forex market trading process.
The system is equipped with the best tools and the successful work of it proved by the Myfxbook live trading results with real money. The backtesting of the system is as good as the real performance. There are guarantees of the quality of the product and a refund policy in case the systems would not fit the customer. For me, all these factors are powerful arguments for the quality of the FXParabol EA.

FXParabol EA Purchase includes

Buy to Get:

  • 1 license for any account
  • Versions for MT4 and MT5
  • Free lifetime updates
  • 24/7 reliable technical support
$289

Refund policy

Developer provide a full money-back guarantee during the first 30 days after purchasing. If EA doesn’t work properly on devs account, and dev cannot do anything about it, he will return your money. If a drawdown on your account exceeds 35%, we will also initiate a refund process, on condition that you have used dev recommended settings and provided proofs of that.

Main Menu

*****************************************************************************************************